library(meteospain)
library(sf)
#> Linking to GEOS 3.12.1, GDAL 3.8.4, PROJ 9.4.0; sf_use_s2() is TRUE
library(purrr)
library(dplyr)
#>
#> Attaching package: 'dplyr'
#> The following objects are masked from 'package:stats':
#>
#>     filter, lag
#> The following objects are masked from 'package:base':
#>
#>     intersect, setdiff, setequal, union
library(ggplot2)
library(units)
#> udunits database from /usr/share/xml/udunits/udunits2.xml

# provide keys for aemet and meteocat if not done already
# keyring::key_set('aemet')
# keyring::key_set('meteocat')
meteospain aims to return stations data in a compatible
format between services. This means:
- Names of meteorological and metadata variables are standardized between services and temporal resolutions.
- Units of numerical variables are standardized between services.
- Same output format for all services, an
sfobject.
This ease combining data from different services. Let’s see an example.
April 2020 daily data
We are gonna download daily data for April, 2020 for all services providing this information, and combine them in one object:
Don’t forget to store the keys for AEMET and MeteoCat if not done already (see code above)
aemet_daily <- get_meteo_from(
    'aemet', aemet_options(
      'daily', start_date = as.Date('2020-04-16'), end_date = as.Date('2020-04-30'),
      api_key = keyring::key_get('aemet')
    )
)
#> ℹ © AEMET. Autorizado el uso de la información y su reproducción citando a
#>   AEMET como autora de la misma.
#> https://www.aemet.es/es/nota_legal

meteocat_daily <- get_meteo_from(
  'meteocat',
  meteocat_options('daily', start_date = as.Date('2020-04-16'), api_key = keyring::key_get('meteocat'))
)
#> iterating ■■■                                7% | ETA: 18s
#> iterating ■■■■                              11% | ETA: 17s
#> iterating ■■■■■■■■■■                        30% | ETA: 12s
#> iterating ■■■■■■■■■■■■■■■■■                 52% | ETA:  8s
#> iterating ■■■■■■■■■■■■■■■■■■■■■■            70% | ETA:  5s
#> iterating ■■■■■■■■■■■■■■■■■■■■■■■■■■■■■■■  100% | ETA:  0s
#> ℹ Data provided by meteo.cat © Servei Meteorològic de Catalunya
#> https://www.meteo.cat/wpweb/avis-legal/#info

meteogalicia_daily <- get_meteo_from(
  'meteogalicia',
  meteogalicia_options('daily', start_date = as.Date('2020-04-16'), end_date = as.Date('2020-04-30'))
)
#> ℹ A información divulgada a través deste servidor ofrécese gratuitamente aos
#>   cidadáns para que poida ser
#> utilizada libremente por eles, co único compromiso de mencionar expresamente a
#> MeteoGalicia e á
#> Consellería de Medio Ambiente, Territorio e Vivenda da Xunta de Galicia como
#> fonte da mesma cada vez
#> que as utilice para os usos distintos do particular e privado.
#> https://www.meteogalicia.gal/aviso-legal

ria_daily <- get_meteo_from(
  'ria',
  ria_options('daily', start_date = as.Date('2020-04-16'), end_date = as.Date('2020-04-30'))
)
#> iterating ■■                                 5% | ETA: 20s
#> iterating ■■■■■                             12% | ETA: 19s
#> iterating ■■■■■■■■■■■                       35% | ETA: 10s
#> iterating ■■■■■■■■■■■■■■■■■                 52% | ETA:  8s
#> iterating ■■■■■■■■■■■■■■■■■■■■■■■           73% | ETA:  4s
#> iterating ■■■■■■■■■■■■■■■■■■■■■■■■■■■■■■    95% | ETA:  1s
#> iterating ■■■■■■■■■■■■■■■■■■■■■■■■■■■■■■■  100% | ETA:  0s
#> ✖ Some stations didn't return data:
#> https://www.juntadeandalucia.es/agriculturaypesca/ifapa/riaws/datosdiarios/forceEt0/21/104/2020-04-16/2020-04-30:
#> HTTP 404 Not Found.
#> https://www.juntadeandalucia.es/agriculturaypesca/ifapa/riaws/datosdiarios/forceEt0/18/9/2020-04-16/2020-04-30:
#> HTTP 404 Not Found.
#> https://www.juntadeandalucia.es/agriculturaypesca/ifapa/riaws/datosdiarios/forceEt0/29/3/2020-04-16/2020-04-30:
#> HTTP 404 Not Found.
#> https://www.juntadeandalucia.es/agriculturaypesca/ifapa/riaws/datosdiarios/forceEt0/29/5/2020-04-16/2020-04-30:
#> HTTP 404 Not Found.
#> https://www.juntadeandalucia.es/agriculturaypesca/ifapa/riaws/datosdiarios/forceEt0/21/1/2020-04-16/2020-04-30:
#> HTTP 404 Not Found.
#> https://www.juntadeandalucia.es/agriculturaypesca/ifapa/riaws/datosdiarios/forceEt0/41/4/2020-04-16/2020-04-30:
#> HTTP 404 Not Found.
#> https://www.juntadeandalucia.es/agriculturaypesca/ifapa/riaws/datosdiarios/forceEt0/21/106/2020-04-16/2020-04-30:
#> HTTP 404 Not Found.
#> https://www.juntadeandalucia.es/agriculturaypesca/ifapa/riaws/datosdiarios/forceEt0/23/9/2020-04-16/2020-04-30:
#> HTTP 404 Not Found.
#> https://www.juntadeandalucia.es/agriculturaypesca/ifapa/riaws/datosdiarios/forceEt0/41/1/2020-04-16/2020-04-30:
#> HTTP 404 Not Found.
#> https://www.juntadeandalucia.es/agriculturaypesca/ifapa/riaws/datosdiarios/forceEt0/23/10/2020-04-16/2020-04-30:
#> HTTP 404 Not Found.
#> https://www.juntadeandalucia.es/agriculturaypesca/ifapa/riaws/datosdiarios/forceEt0/23/13/2020-04-16/2020-04-30:
#> HTTP 404 Not Found.
#> https://www.juntadeandalucia.es/agriculturaypesca/ifapa/riaws/datosdiarios/forceEt0/21/12/2020-04-16/2020-04-30:
#> HTTP 404 Not Found.
#> https://www.juntadeandalucia.es/agriculturaypesca/ifapa/riaws/datosdiarios/forceEt0/4/3/2020-04-16/2020-04-30:
#> HTTP 404 Not Found.
#> https://www.juntadeandalucia.es/agriculturaypesca/ifapa/riaws/datosdiarios/forceEt0/14/3/2020-04-16/2020-04-30:
#> HTTP 404 Not Found.
#> https://www.juntadeandalucia.es/agriculturaypesca/ifapa/riaws/datosdiarios/forceEt0/21/107/2020-04-16/2020-04-30:
#> HTTP 404 Not Found.
#> https://www.juntadeandalucia.es/agriculturaypesca/ifapa/riaws/datosdiarios/forceEt0/18/4/2020-04-16/2020-04-30:
#> HTTP 404 Not Found.
#> https://www.juntadeandalucia.es/agriculturaypesca/ifapa/riaws/datosdiarios/forceEt0/11/8/2020-04-16/2020-04-30:
#> HTTP 404 Not Found.
#> https://www.juntadeandalucia.es/agriculturaypesca/ifapa/riaws/datosdiarios/forceEt0/11/3/2020-04-16/2020-04-30:
#> HTTP 404 Not Found.
#> https://www.juntadeandalucia.es/agriculturaypesca/ifapa/riaws/datosdiarios/forceEt0/11/9/2020-04-16/2020-04-30:
#> HTTP 404 Not Found.
#> https://www.juntadeandalucia.es/agriculturaypesca/ifapa/riaws/datosdiarios/forceEt0/4/9/2020-04-16/2020-04-30:
#> HTTP 404 Not Found.
#> https://www.juntadeandalucia.es/agriculturaypesca/ifapa/riaws/datosdiarios/forceEt0/41/6/2020-04-16/2020-04-30:
#> HTTP 404 Not Found.
#> https://www.juntadeandalucia.es/agriculturaypesca/ifapa/riaws/datosdiarios/forceEt0/41/14/2020-04-16/2020-04-30:
#> HTTP 404 Not Found.ℹ Data provided by Red de Información Agroclimática de Andalucía (RIA)
#> https://www.juntadeandalucia.es/agriculturaypesca/ifapa/riaweb/web/
Now we have all daily data for April, lets join them. We are gonna
use the purrr package to do it in one pipe.
Here we convert the data to tibble before the join, that way we are not
joining by the spatial data, but by timestamp and the stations metadata.
After the join we convert back to sf.
april_2020_spain <- list(
  dplyr::as_tibble(aemet_daily),
  dplyr::as_tibble(meteocat_daily),
  dplyr::as_tibble(meteogalicia_daily),
  dplyr::as_tibble(ria_daily)
) |>
  purrr::reduce(dplyr::full_join) |>
  sf::st_as_sf()
#> Joining with `by = join_by(timestamp, service, station_id, station_name,
#> station_province, altitude, mean_temperature, min_temperature, max_temperature,
#> mean_relative_humidity, min_relative_humidity, max_relative_humidity,
#> precipitation, mean_wind_speed, max_wind_speed, max_atmospheric_pressure,
#> min_atmospheric_pressure, geometry)`
#> Joining with `by = join_by(timestamp, service, station_id, station_name,
#> station_province, altitude, mean_temperature, min_temperature, max_temperature,
#> mean_relative_humidity, min_relative_humidity, max_relative_humidity,
#> precipitation, mean_wind_speed, max_wind_speed, insolation, geometry,
#> mean_wind_direction, max_wind_direction, mean_atmospheric_pressure,
#> reference_evapotranspiration)`
#> Joining with `by = join_by(timestamp, service, station_id, station_name,
#> station_province, altitude, mean_temperature, min_temperature, max_temperature,
#> mean_relative_humidity, min_relative_humidity, max_relative_humidity,
#> precipitation, mean_wind_speed, max_wind_speed, geometry, mean_wind_direction,
#> max_wind_direction)`

april_2020_spain
#> Simple feature collection with 22197 features and 43 fields (with 150 geometries empty)
#> Geometry type: POINT
#> Dimension:     XY
#> Bounding box:  xmin: -18.115 ymin: 27.66528 xmax: 4.323889 ymax: 43.78611
#> Geodetic CRS:  WGS 84
#> # A tibble: 22,197 × 44
#>    timestamp           service station_id station_name station_province altitude
#>    <dttm>              <chr>   <chr>      <chr>        <chr>                 [m]
#>  1 2020-04-16 00:00:00 aemet   0009X      "ALFORJA"    TARRAGONA             406
#>  2 2020-04-16 00:00:00 aemet   0016A      "REUS AEROP… TARRAGONA              71
#>  3 2020-04-16 00:00:00 aemet   0016B      "REUS (CENT… TARRAGONA             118
#>  4 2020-04-16 00:00:00 aemet   0034X      "VALLS"      TARRAGONA             233
#>  5 2020-04-16 00:00:00 aemet   0042Y      "TARRAGONA " TARRAGONA              55
#>  6 2020-04-16 00:00:00 aemet   0061X      "PONTONS"    BARCELONA             632
#>  7 2020-04-16 00:00:00 aemet   0066X      "VILAFRANCA… BARCELONA             177
#>  8 2020-04-16 00:00:00 aemet   0073X      "SITGES"     BARCELONA              58
#>  9 2020-04-16 00:00:00 aemet   0076       "BARCELONA … BARCELONA               4
#> 10 2020-04-16 00:00:00 aemet   0092X      "BERGA"      BARCELONA             682
#> # ℹ 22,187 more rows
#> # ℹ 38 more variables: mean_temperature [°C], min_temperature [°C],
#> #   max_temperature [°C], mean_relative_humidity [%],
#> #   min_relative_humidity [%], max_relative_humidity [%],
#> #   precipitation [L/m^2], wind_direction [°], mean_wind_speed [m/s],
#> #   max_wind_speed [m/s], insolation [h], max_atmospheric_pressure [hPa],
#> #   min_atmospheric_pressure [hPa], geometry <POINT [°]>, …
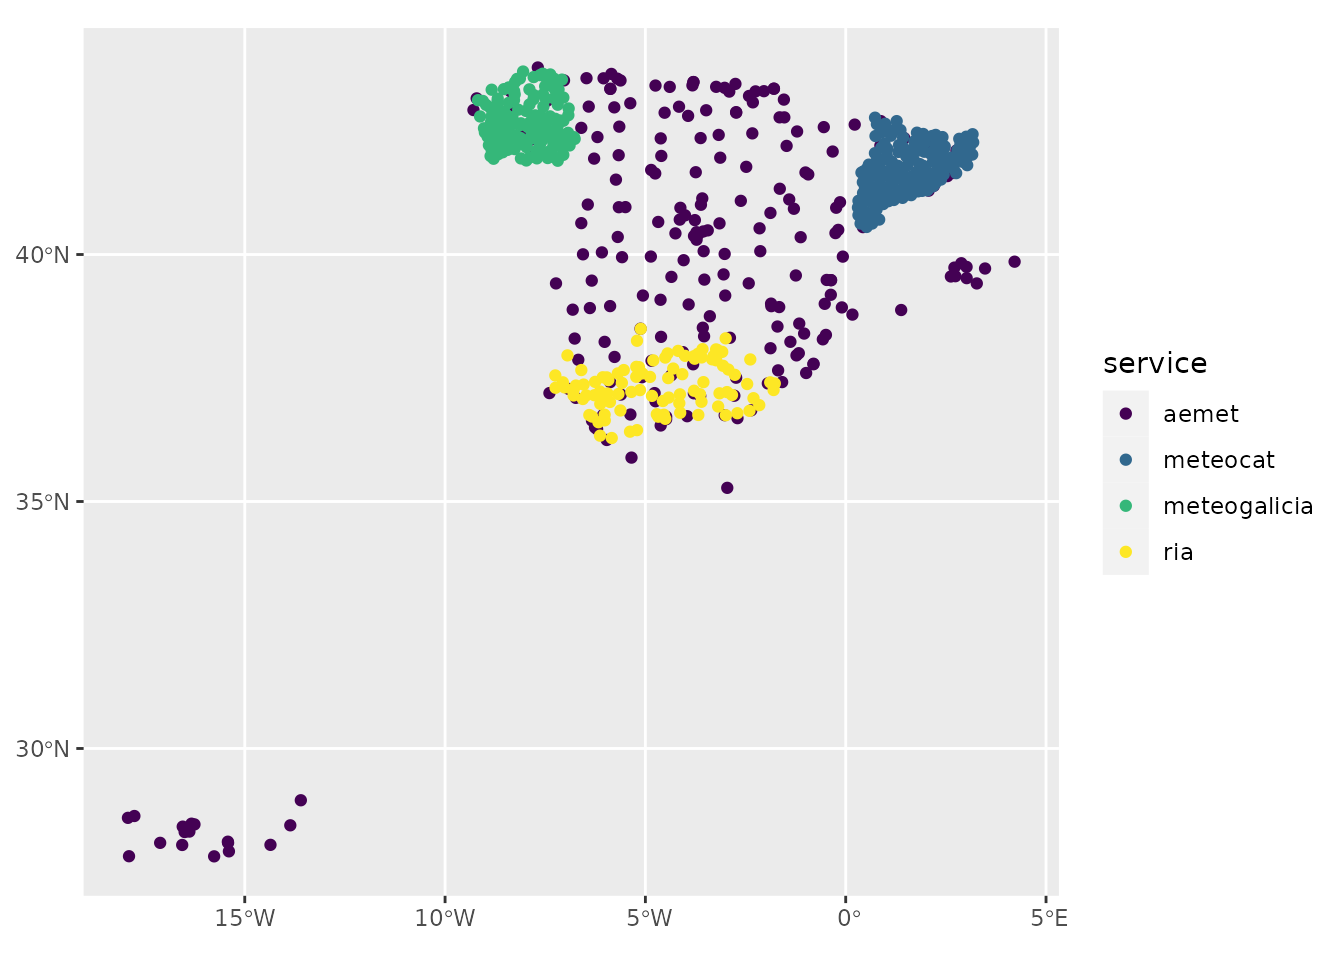
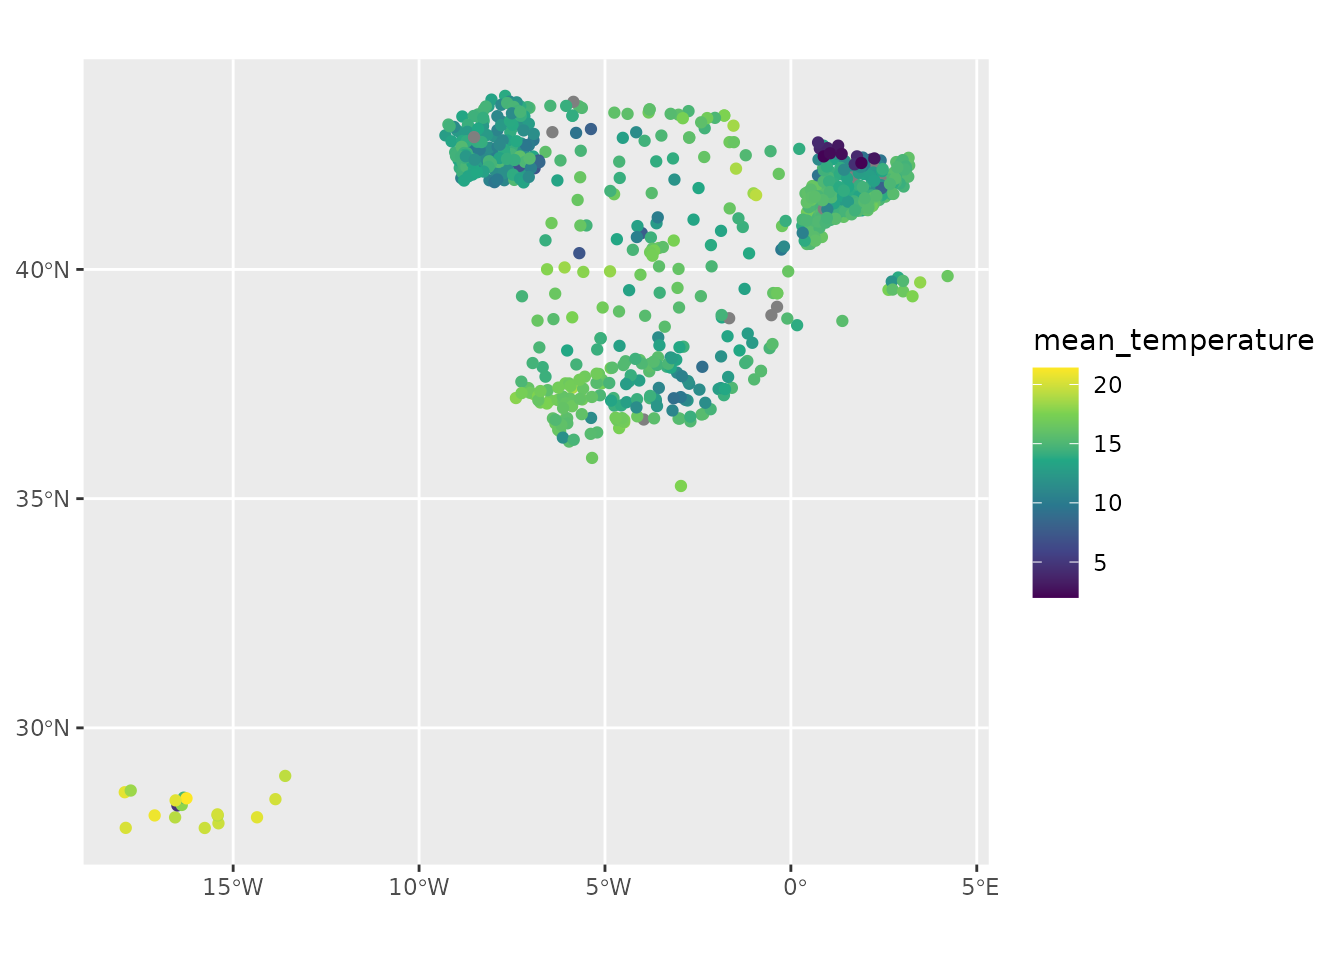
We can visualize the data, only one day.
By service
april_2020_spain |>
  dplyr::filter(lubridate::day(timestamp) == 25) |>
  units::drop_units() |>
  ggplot(aes(colour = service)) +
  geom_sf() +
  scale_colour_viridis_d()
By one variable
april_2020_spain |>
  dplyr::filter(lubridate::day(timestamp) == 25) |>
  units::drop_units() |>
  ggplot(aes(colour = mean_temperature)) +
  geom_sf() +
  scale_colour_viridis_c()