Function for plotting vertical forest profiles.
Arguments
- x
An object of class
forest.- SpParams
A data frame with species parameters (see
SpParamsMED).- type
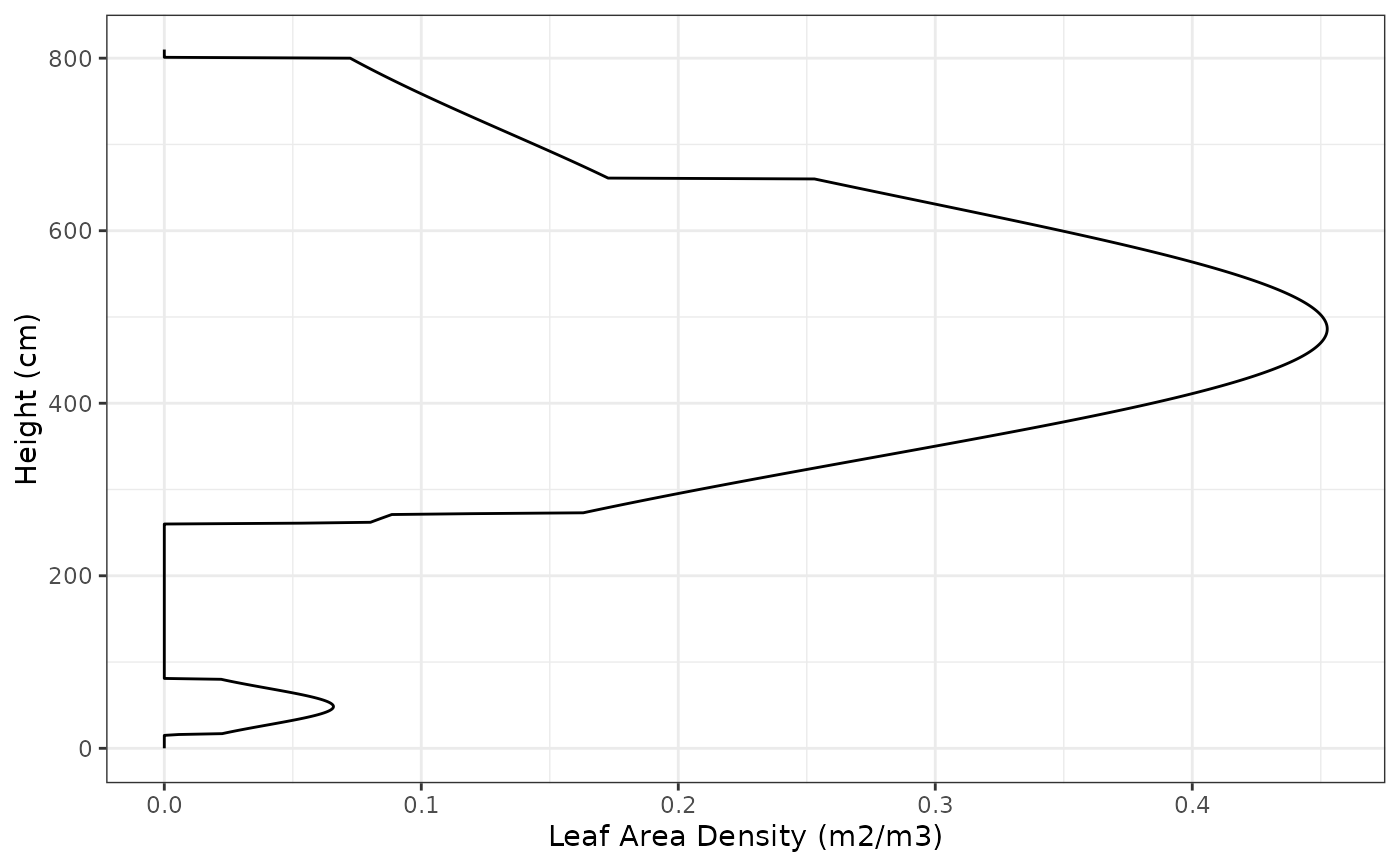
A string of the plot type: "LeafAreaDensity", "RootDistribution", "FuelBulkDensity", "PARExtinction", "SWRExtinction" or "WindExtinction".
- byCohorts
A logical flag to separate profiles for each cohort.
- bySpecies
A logical flag to aggregate results by species.
- includeHerbs
A logical flag to include herbaceous layer in the profile.
- includeMistletoes
Include hemi-parasitic plants (mistletoes) in the profile.
- ...
Additional parameters to vertical profiles
Details
The function is a common wrapper to specialized internal functions (see vprofile_leafAreaDensity).