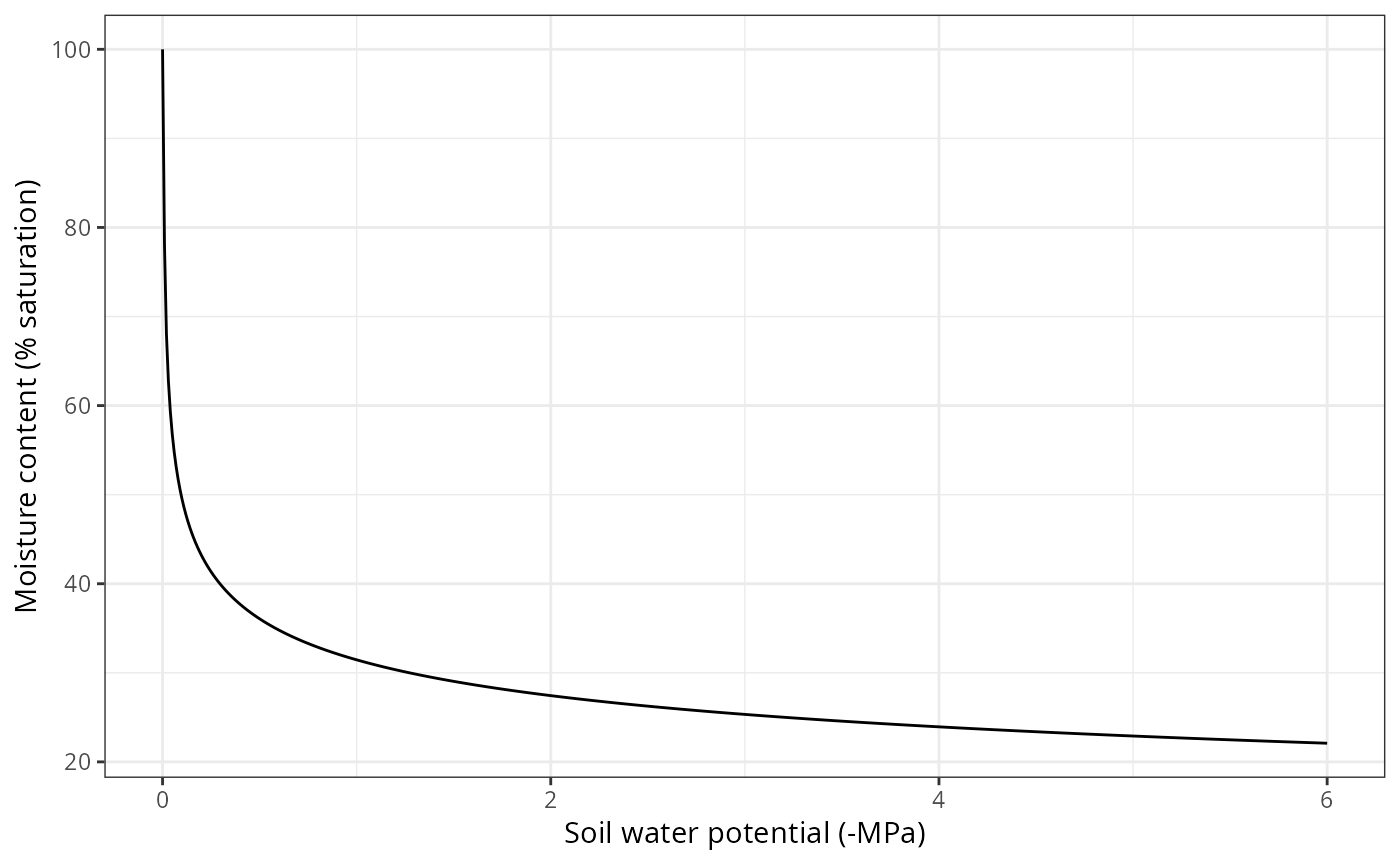
Function for plotting water retention or conductivity curves for soil layers.
Usage
# S3 method for class 'soil'
plot(
  x,
  type = "RetentionCurve",
  model = "SX",
  layer = 1,
  relative = TRUE,
  to = "SAT",
  ...
)
Arguments
- x
Initialized soil object (returned by function
soil).- type
A string of the plot type: "RetentionCurve" or "ConductivityCurve".
- model
model Either 'SX' or 'VG' for Saxton's or Van Genuchten's water retention models; or 'both' to plot both retention models.
- layer
Soil layer to be plotted.
- relative
Boolean flag to indicate that retention curve should be relative to field capacity or saturation.
- to
Either 'SAT' (saturation) or 'FC' (field capacity).
- ...
Additional parameters to specific functions
Details
The function is a common wrapper to specialized internal functions (see soil_retentionCurvePlot).
Examples
# Initializes soil
s = soil(defaultSoilParams())
plot(s)